Annotating & Analyzing 1GB+ volumes without deployment complexity and costs
Ported a PyQt desktop microscopy tool to a feature complete static PWA, backed by a Python core running in Pyodide, a lazy computation layer, and a GPU accelerated React viewer.
- Client
- UC Davis Medical
- Year
- 2025
- Read
- 8 min
- Role
- Bioinformatics & Imaging Visual Analytics Researcher
- WebAssembly - WASM
- Lazy computation & Vectorization
- Visual analytics
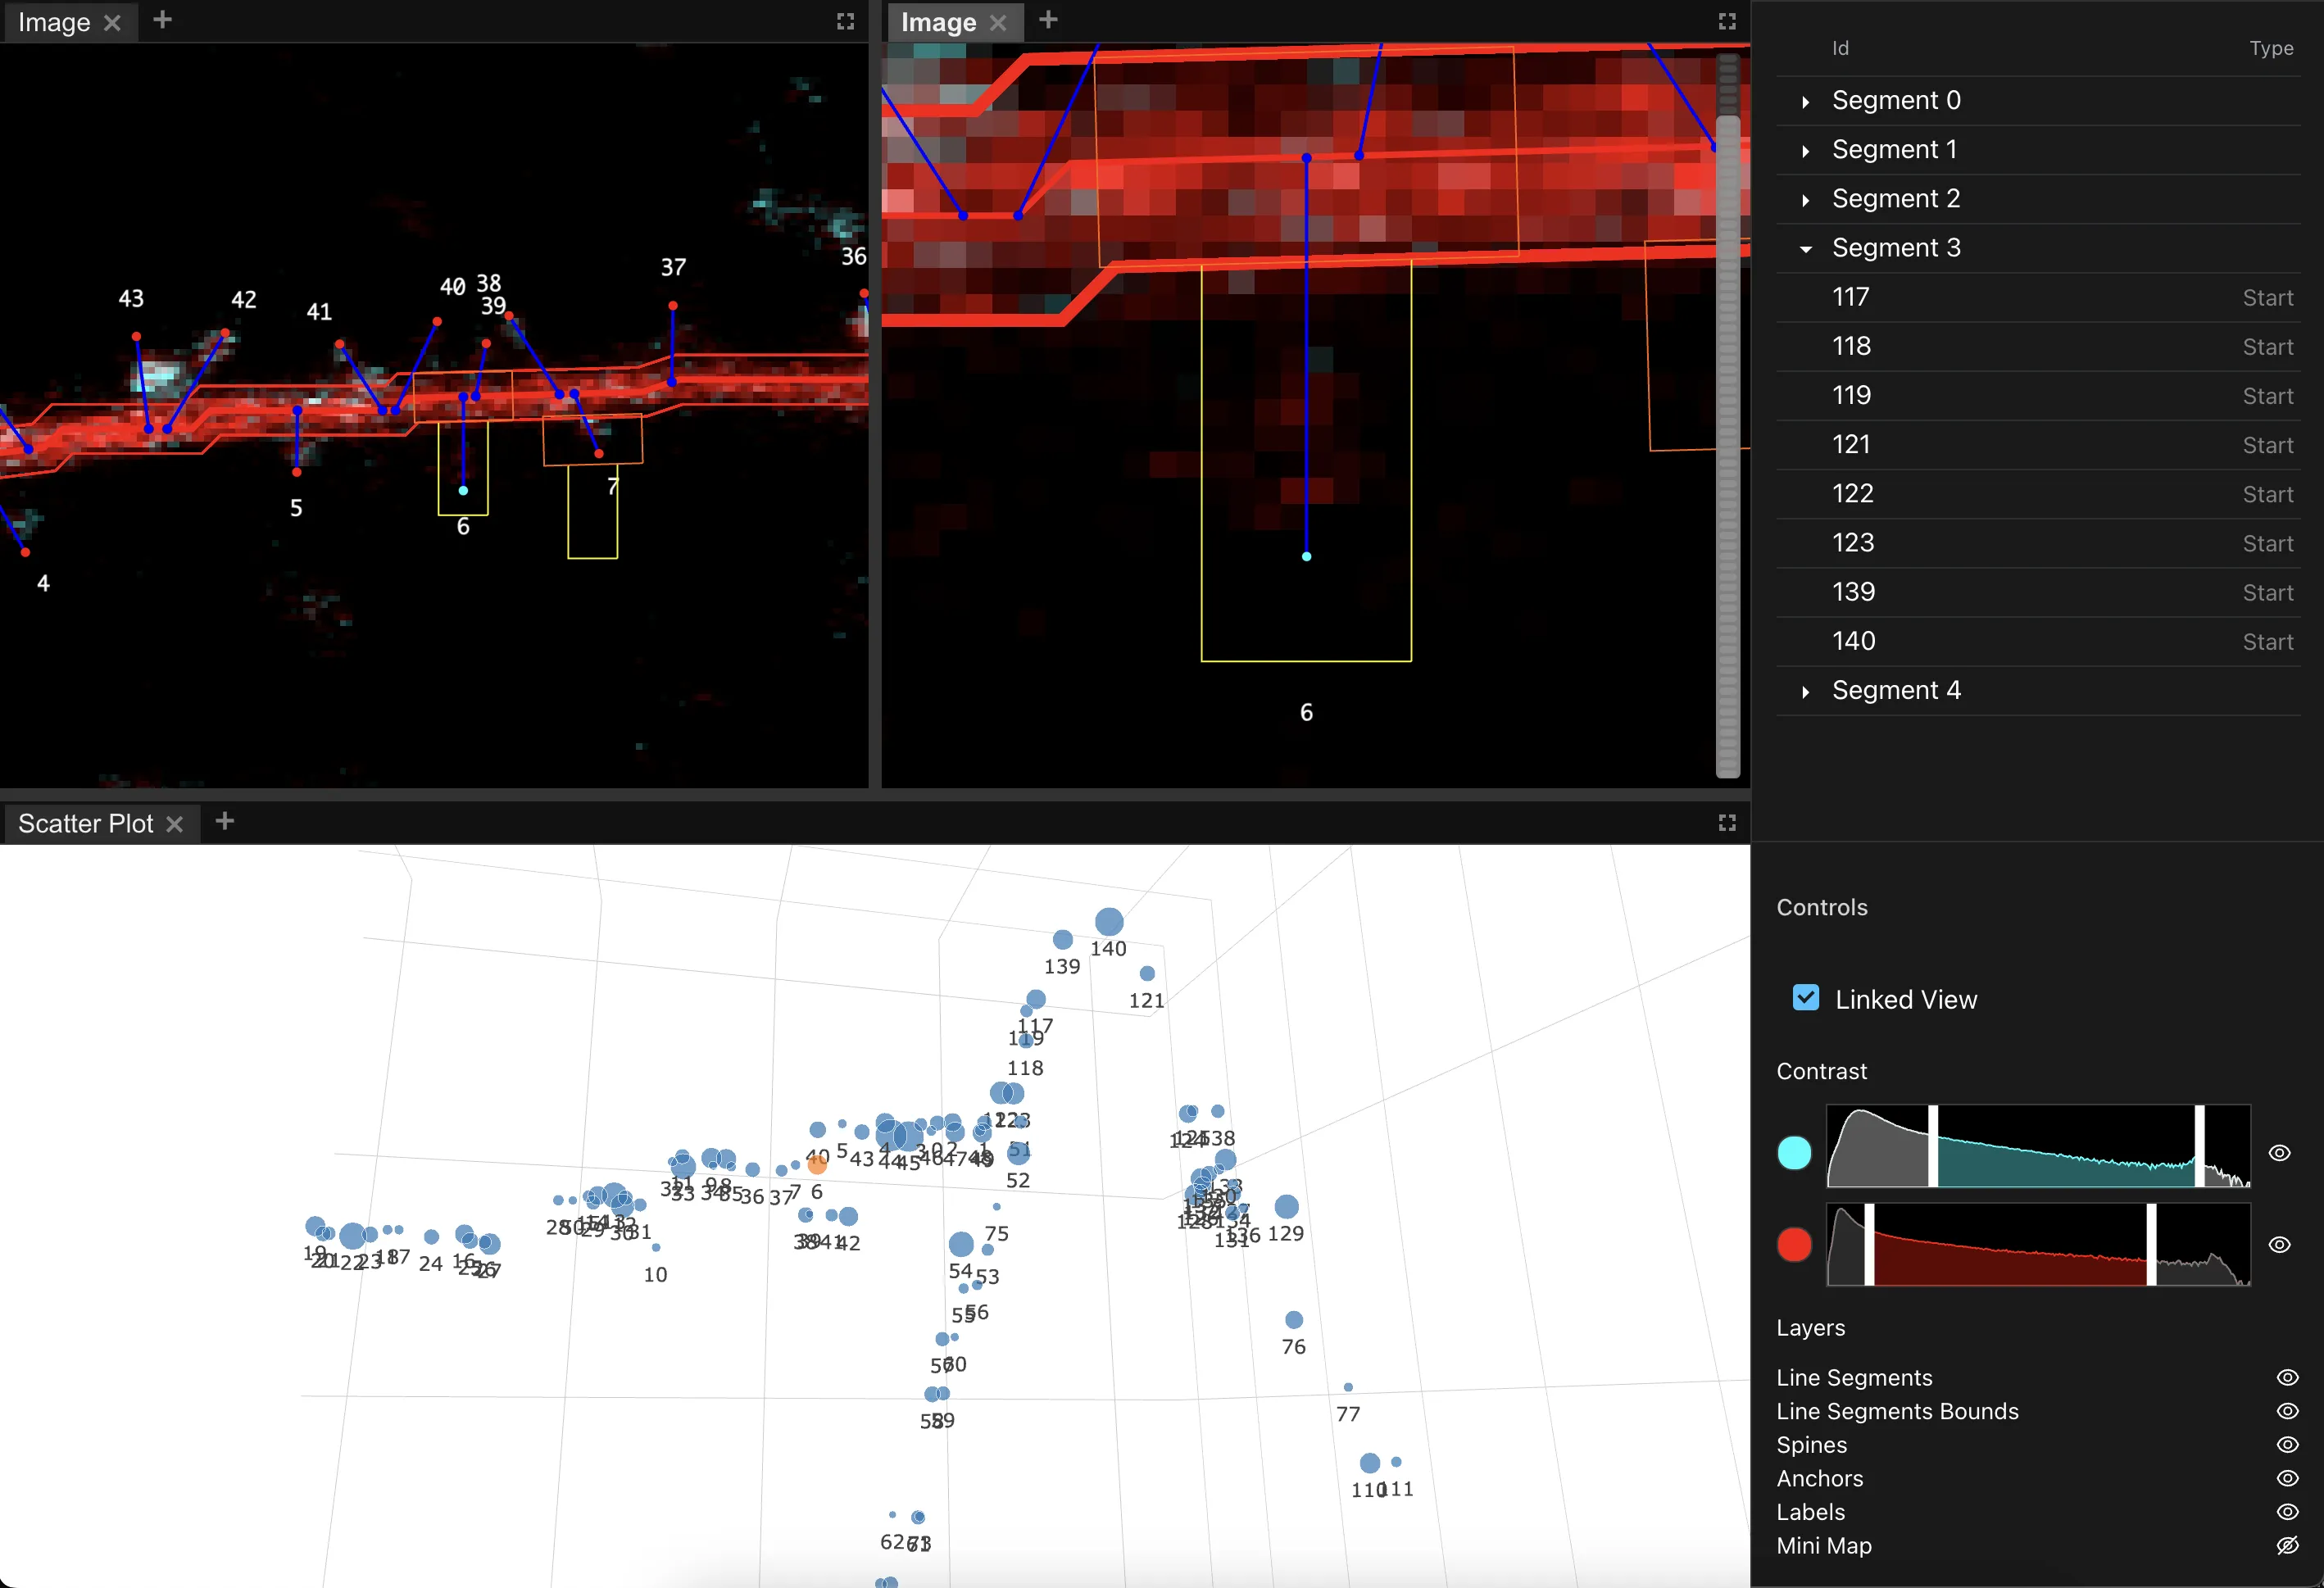
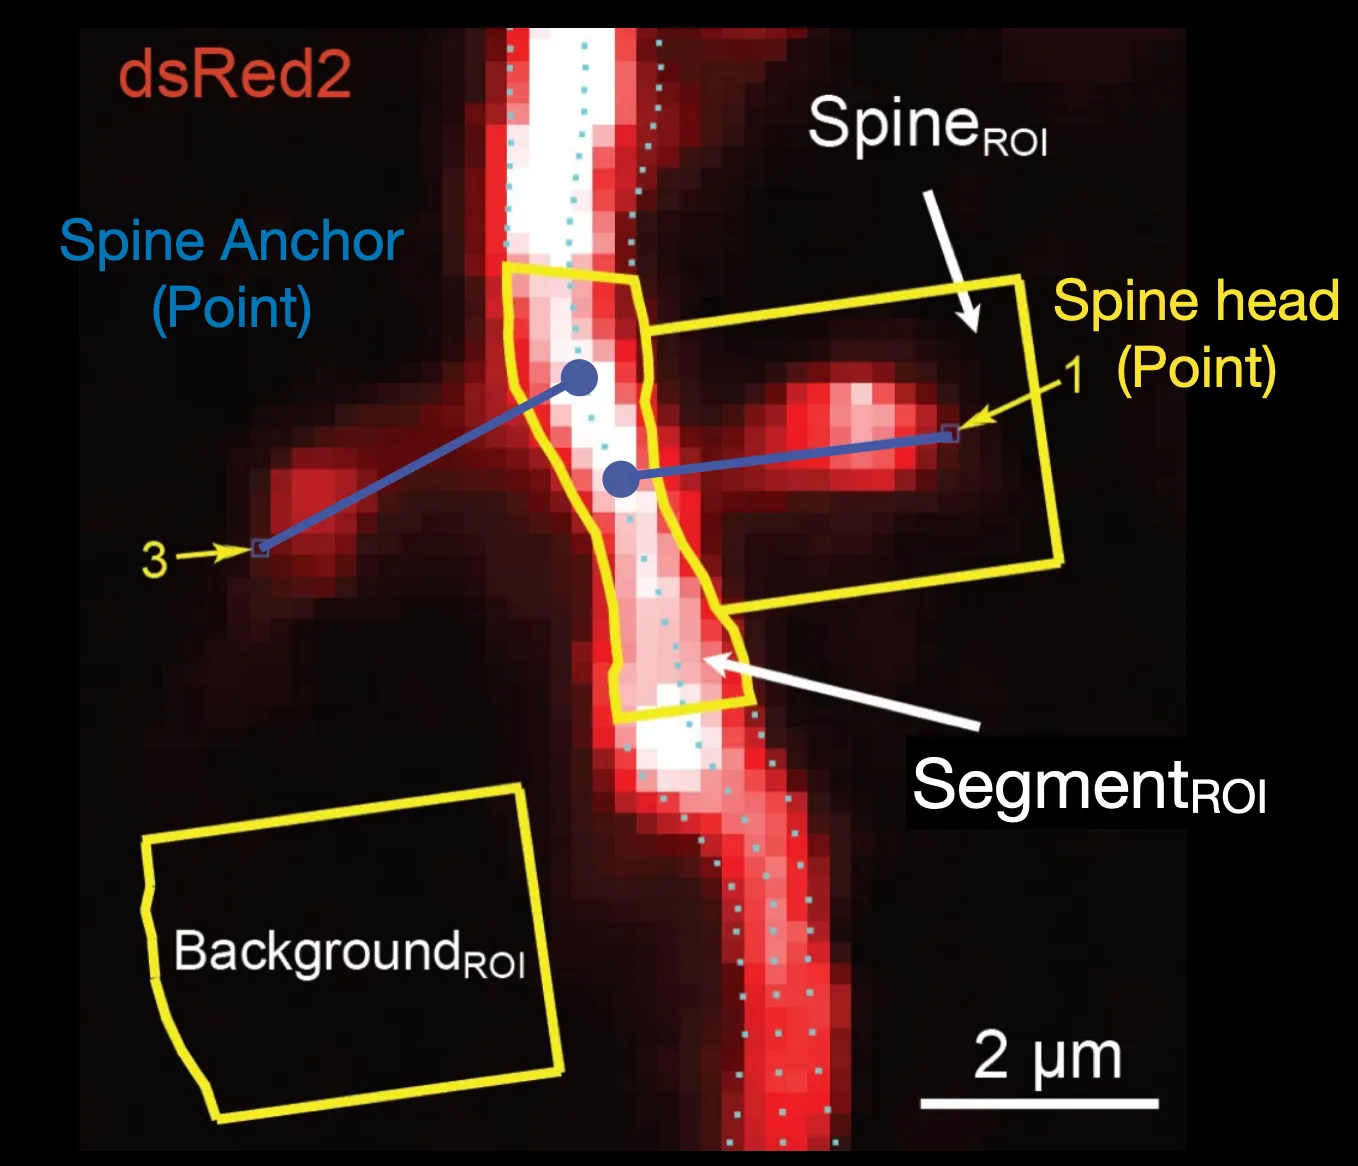
MapManager is a neuronal spine analysis platform for biology labs. Spines are small protrusions on dendrites; their geometry and fluorescence intensity over time are used to infer synaptic plasticity. The original application was a PyQt desktop program, and the project was to make it a browser based tool without giving up the numerical consistency and speed of the native workflow.
The problem
Desktop imaging tools are powerful but costly to distribute: native dependencies, per platform builds, and installation friction limit adoption in smaller labs. Native PyQt deployments also struggle to stay maintained across versions. The replacement had to satisfy three constraints:
- Run with no backend: labs work with local files, and a client server model adds latency, hosting cost, and maintenance burden for data that is already on the researcher’s disk.
- Keep interaction responsive under rapid, drag and drop annotation of dense image volumes.
- Preserve a single analytical core so desktop, web, and scripted workflows agree.
A browser platform also had to solve browser limits itself: no direct file system in the stable path at the time, limited WebGL contexts, no easy multi-threading, and no native access to Python’s scientific stack.
Approach
The architecture splits the application into two layers:
- Core library, written in Python, owns the analytical model: annotations, geometry, LazyPandas data frames, mutation and undo/redo, and serialization.
- Web application, written in React, owns rendering and interaction. It runs the core through Pyodide inside a Web Worker equivalent runtime and serializes values across the Python/JavaScript boundary through a proxy class.
This means new annotations and analysis logic are implemented once in Python, while each platform only has to implement a rendering surface.
LazyPandas: lazy computation without losing the Pandas feel
The core bottleneck was not rendering, it was analysis. Annotating a spine produces a region of interest, and each ROI needs aggregate statistics over one or more image channels. Recomputing those aggregates on every cursor movement would make drag and drop interaction unusable.
LazyPandas models a data frame as a Python class with a typed schema. Columns are declared explicitly as either base columns (raw data) or computed columns (methods). Computed columns declare their dependencies; when a base value changes, only the transitive dependents are marked invalid. When a caller requests a cell, it is recomputed if invalid, otherwise the cached value is returned. Mutations are at the individual cell level, so sparse, clustered edits cost roughly what was changed instead of the whole column.
from lazy_geo_pandas import schema, compute
from shapely.geometry import Point

@schema(
    index=["spineID", "timePoint"],
    relationships={"Segment": ["segmentID", "timePoint"]},
)
class SimpleSpine:
    spineID: int
    timePoint: int
    segmentID: int
    tip: Point
    anchor: Point

    @compute(dependencies=["anchor", "tip"])
    def spineLength(frame):
        return frame["anchor"].distance(frame["tip"])
The invalidation is dependency aware: an edit to anchor invalidates spineLength and anything downstream, but unrelated columns remain valid. Undo and redo are implemented as a diff log over base mutations, so reverting is a series of inverse cell writes rather than a snapshot restore. The query surface is intentionally Pandas like (frame["roiStat_ch1_max"]), so experienced scripters can compose queries without learning a new API.
Image analysis extension
The base LazyPandas module knows nothing about pixels. Image aggregation is a separate extension that plugs into it: it registers image loaders, a decorator for ROI aggregates, and functions for extracting the pixels bounded by a shape. A schema then declares something like:
@aggregateROI(dependencies=["roi"], aggregate=["sum", "max"])
def roiStat(frame):
    return frame["roi"]
The extension computes the aggregates lazily and names them predictably as roiStat_ch1_max. That keeps imaging specific complexity out of the generic data frame module and out of the rest of the core.
Web viewer
The React viewer uses FlexLayout to host multiple views in one window: the image viewer with annotation overlays, a scatter plot, and a table view. Views are plugins that each provide a render component and an inspector component sharing state. A proxy class wraps the Python core so components can call into it without handling serialization details themselves.
The primary viewer uses WebGL through Deck.gl for rendering annotations and image pixels. Browsers cap the number of WebGL contexts per page, so a single shared WebGL context spans the window and plugin views render into it with transparent backgrounds. All interactivity (click, hover, drag) is defined in the Python core and propagated as layer events, which keeps desktop and web behaviour consistent. Specific pieces include:
- A shared WebGL context React component, so new WebGL views do not each create a context
- Deck.gl rendering for image channels and annotation layers
- A D3 built z axis scroll indicator with arrow key and wheel navigation allowing users to scroll through the layers and select a range of layers in one familiar scroll bar like control
- Linked selections, so a selection in the scatter plot highlights in the image and table
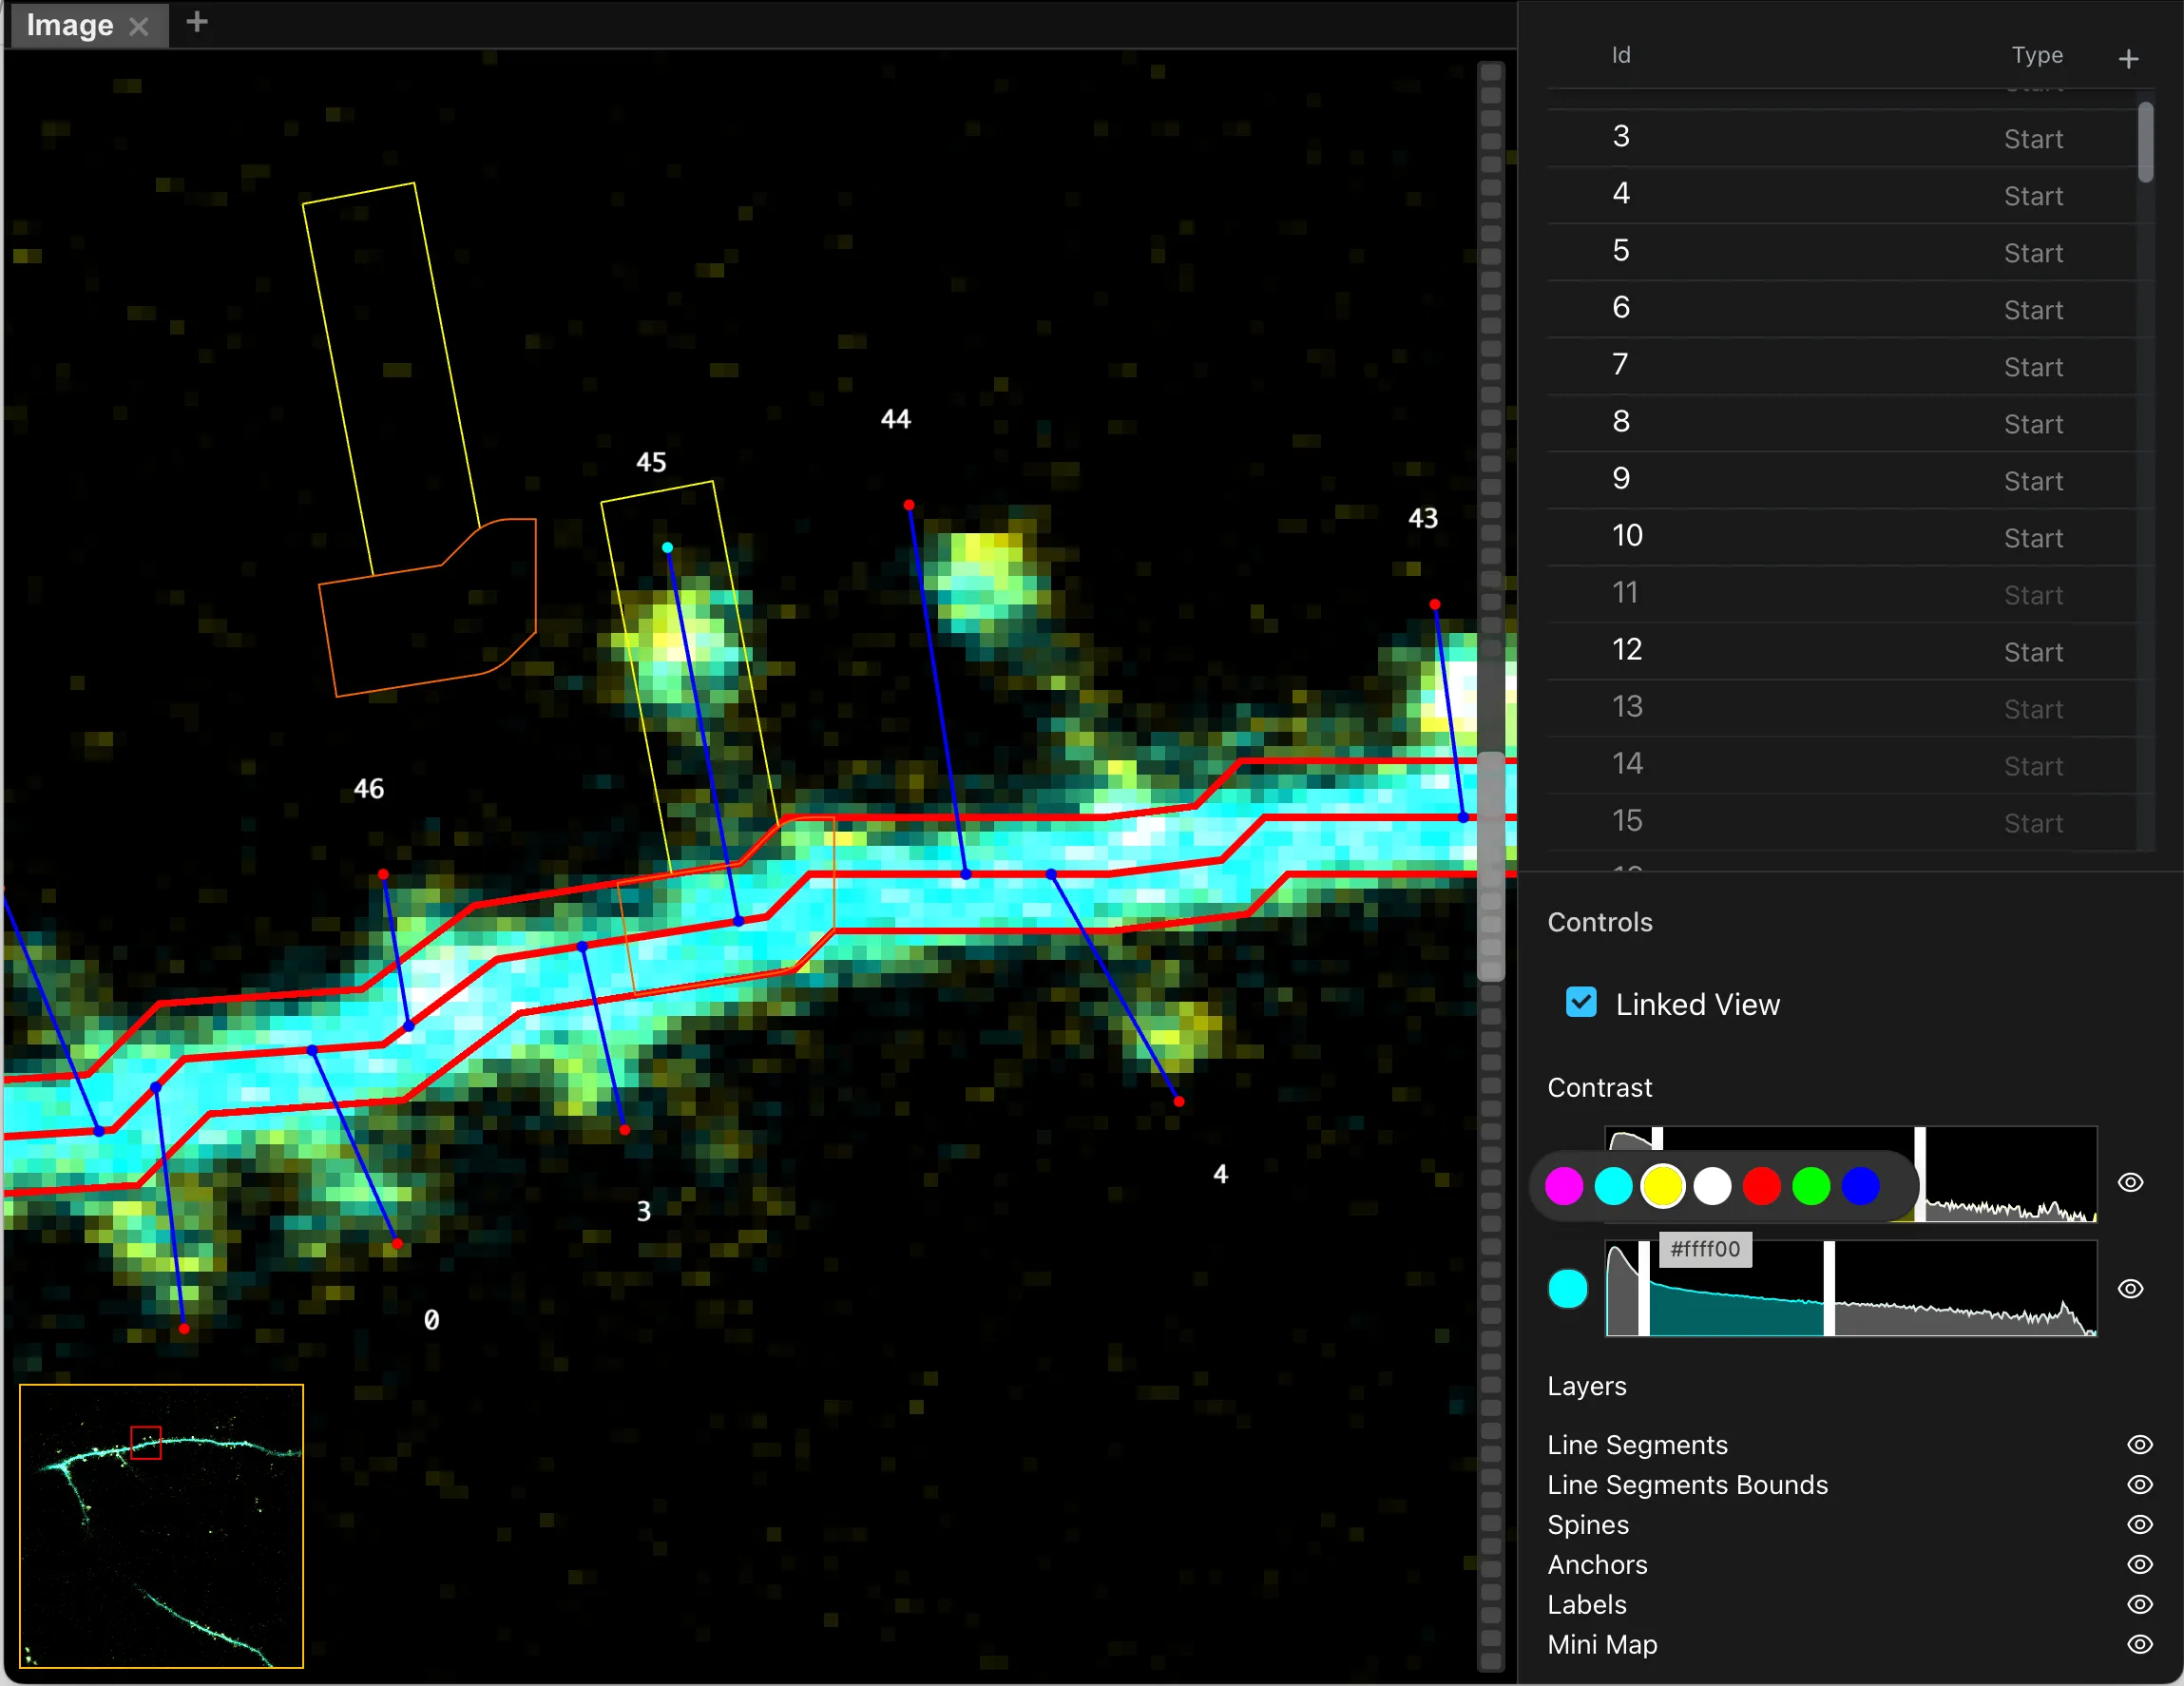
Linked views share selections in both directions, so annotating a spine in the image updates the table and scatter plot immediately.
Scripting
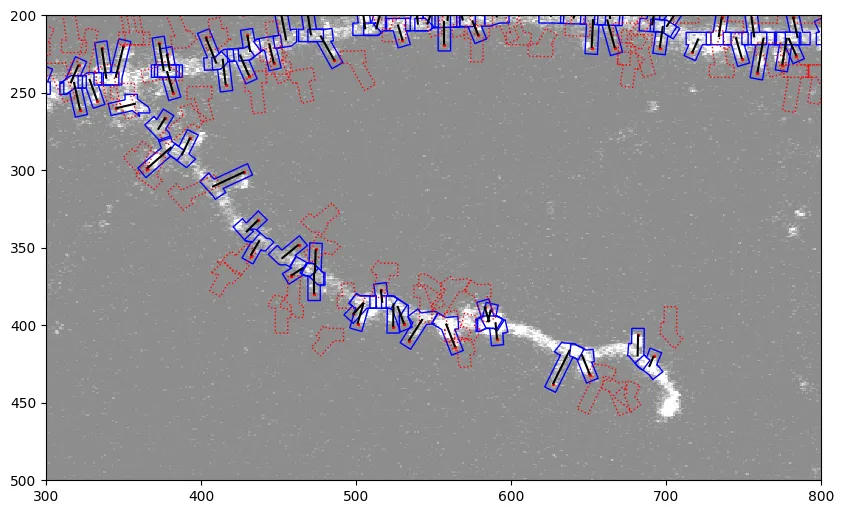
Because the core is a library rather than an embedded engine, the same API is available to scripts and notebooks. Users can load a map, mutate annotations, compute aggregates, and render plots using familiar interfaces that plotting libraries and pandas use:
from mapmanagercore import MapAnnotations
import matplotlib.pyplot as plt

map_manager = MapAnnotations.load("a.mmap")
time_point = map_manager.getTimePoint(0)

fig, ax = plt.subplots(figsize=(10, 10))
time_point.points["point"].plot(color="red", marker="o", markersize=2, ax=ax)
time_point.points["anchorLine"].plot(color="black", ax=ax)
time_point.points["roi"].plot(edgecolor="blue", color=(0, 0, 0, 0), ax=ax)
time_point.getPixels(channel=0).plot(ax=ax, vmin=300, vmax=1500, alpha=0.45, cmap="gray")
plt.show()
That makes custom batch analysis and publication figures possible without touching the application code.
Performance results
The lazy invalidation model was measured against the original PyQt implementation on the same rapid mutation annotation workload; dragging anchors and spines while aggregates refresh. On one benchmark, a 113x speedup on a large volume analysis with multiple updates and mutations. This enabled live updates on many analytics because lazy computations occur on demand. That means without implementation complexity, we only compute what is needed when it is needed. Hence, the UIs can render updates that are required without the overhead of manually tracking or invalidating the entire table. As a result fluid live interactions could dominate the interface allowing analyzers to see results as they drag boundaries and components.
The gains come from a mixture of updates that includes: lazy cells that only compute what is shown, vectorization of requested recomputes, and refined binary representations of the data and transport.
- cell level recomputation with dependencies
- Lazy
- Shared core (python) across web, scripting, & desktop
- Shared
What went wrong and what is still unbuilt
- WebGL contexts are limited, so tabs cannot just allocate its own context. To overcome this limitation, a shared WebGL context was used. This introduced complexity to the rendering system. Abstractions were used so that it is still as simple as running any other view plugin, but it introduced underlying complexities with regard to rendering layers, propagating interactions, and fitting views into that single context.
- Crossing the Python/JavaScript boundary required a proxy class over the core. Every method exposed to components has to stay serialization friendly, and efficiently represented to minimize copies and serialization overhead.
- Pyodide is heavy to start; while free to host without a server backend it still has a startup cost that slows down initial page loads.
- Multi user or shared sessions are out of scope; a multiplayer layer would need a server, which the current design deliberately avoids, adding deployment costs.
Future work
The core is deliberately narrower than the product. Natural next steps, some of which are already sketched:
- Parallelize cell and column evaluation; the dependency graph is acyclic at the column level, so cells are independently computable. Vectorization was prioritized over parallelization due to limitations of parallelization in the web.
- Generalize the UI plugin and layer system so more UI components and their state can be defined in Python and rendered natively by each platform by implementing foundational UI component adapters that can be reused across platforms.
- Multiplayer editing with a minimal coordination server, plus a shareable “story mode” where a citation URL reopens the analysis with preloaded analytics history.
- Broader generalization beyond neuronal spines toward an image ROI analysis platform aligned with the OME Zarr standard.
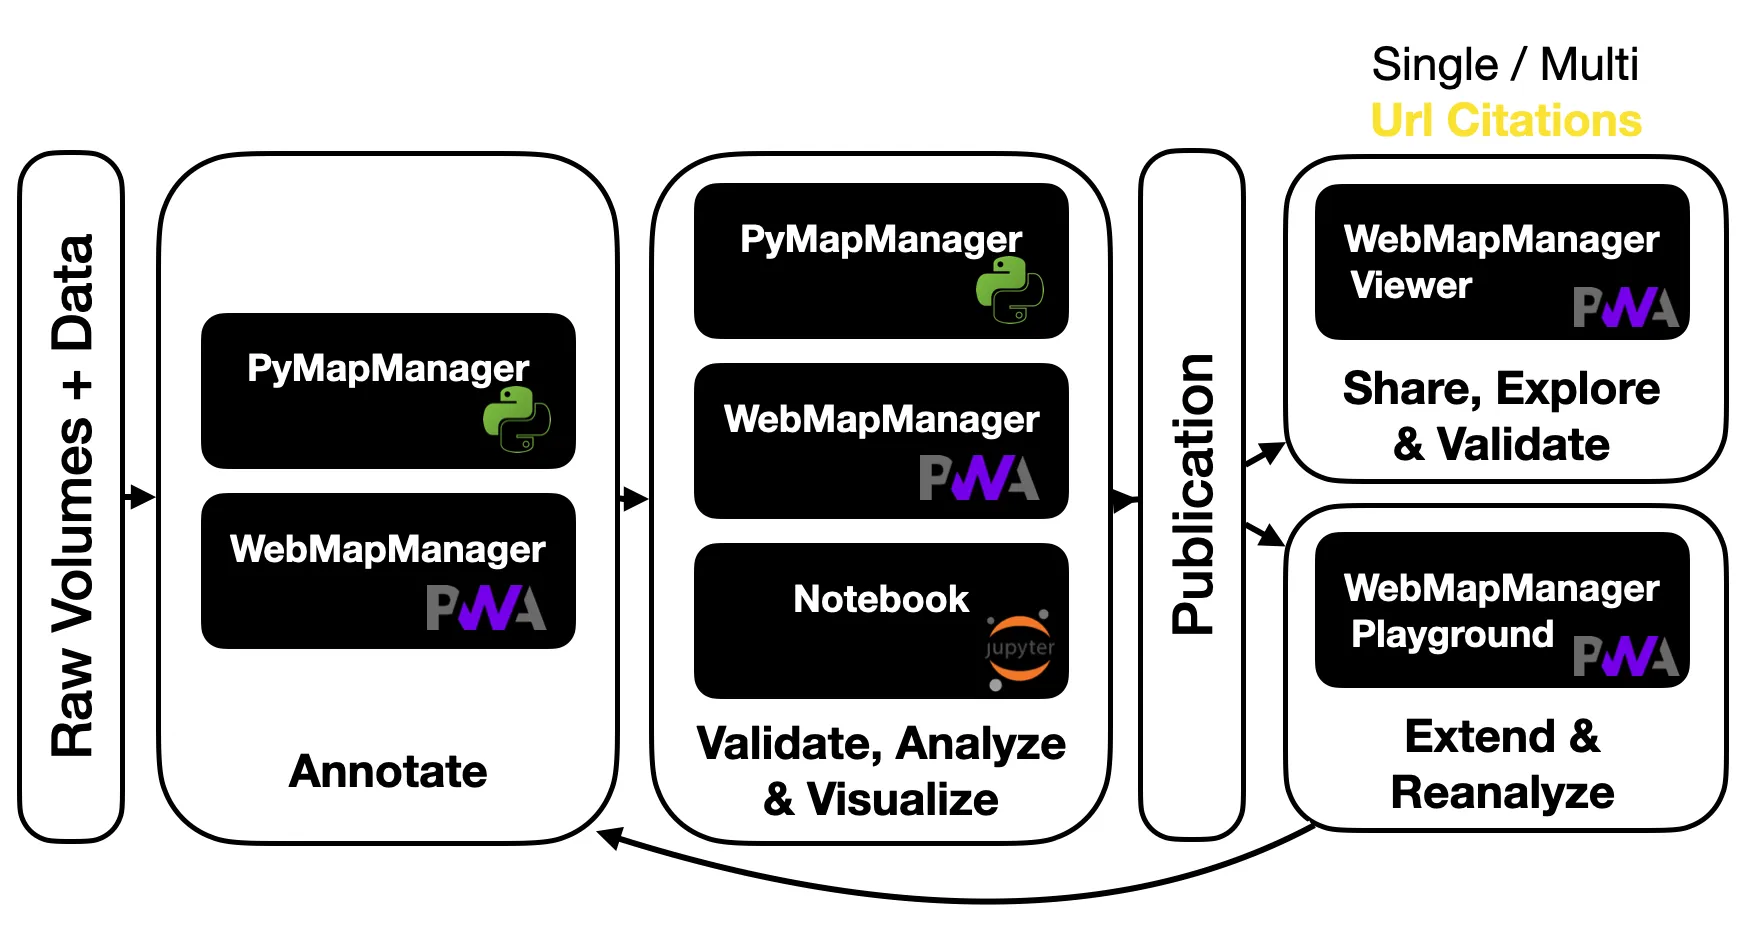
Summary
The project replaced a fragile desktop only install with a browser entry point that runs a Python core that was extracted and optimized from the legacy codebase through Pyodide. The core implements multiple abstractions and optimizations like lazy cell computation and undo/redo, and lazy image analytics. GPU accelerated, plugin based React viewer. The shared core and the LazyPandas foundation are the reusable pieces, and the rest of the stack stays thin.