Making classical machine learning approachable through interactive visualizations
An educational approach to classical machine learning that uses interactive visualizations to make algorithm selection and hyperparameter tuning intuitive.
- Client
- ML ExploroVis
- Year
- 2019
- Read
- 3 min
- Role
- Teaching Assistant
- Interactive visualization
- Machine learning
- Education
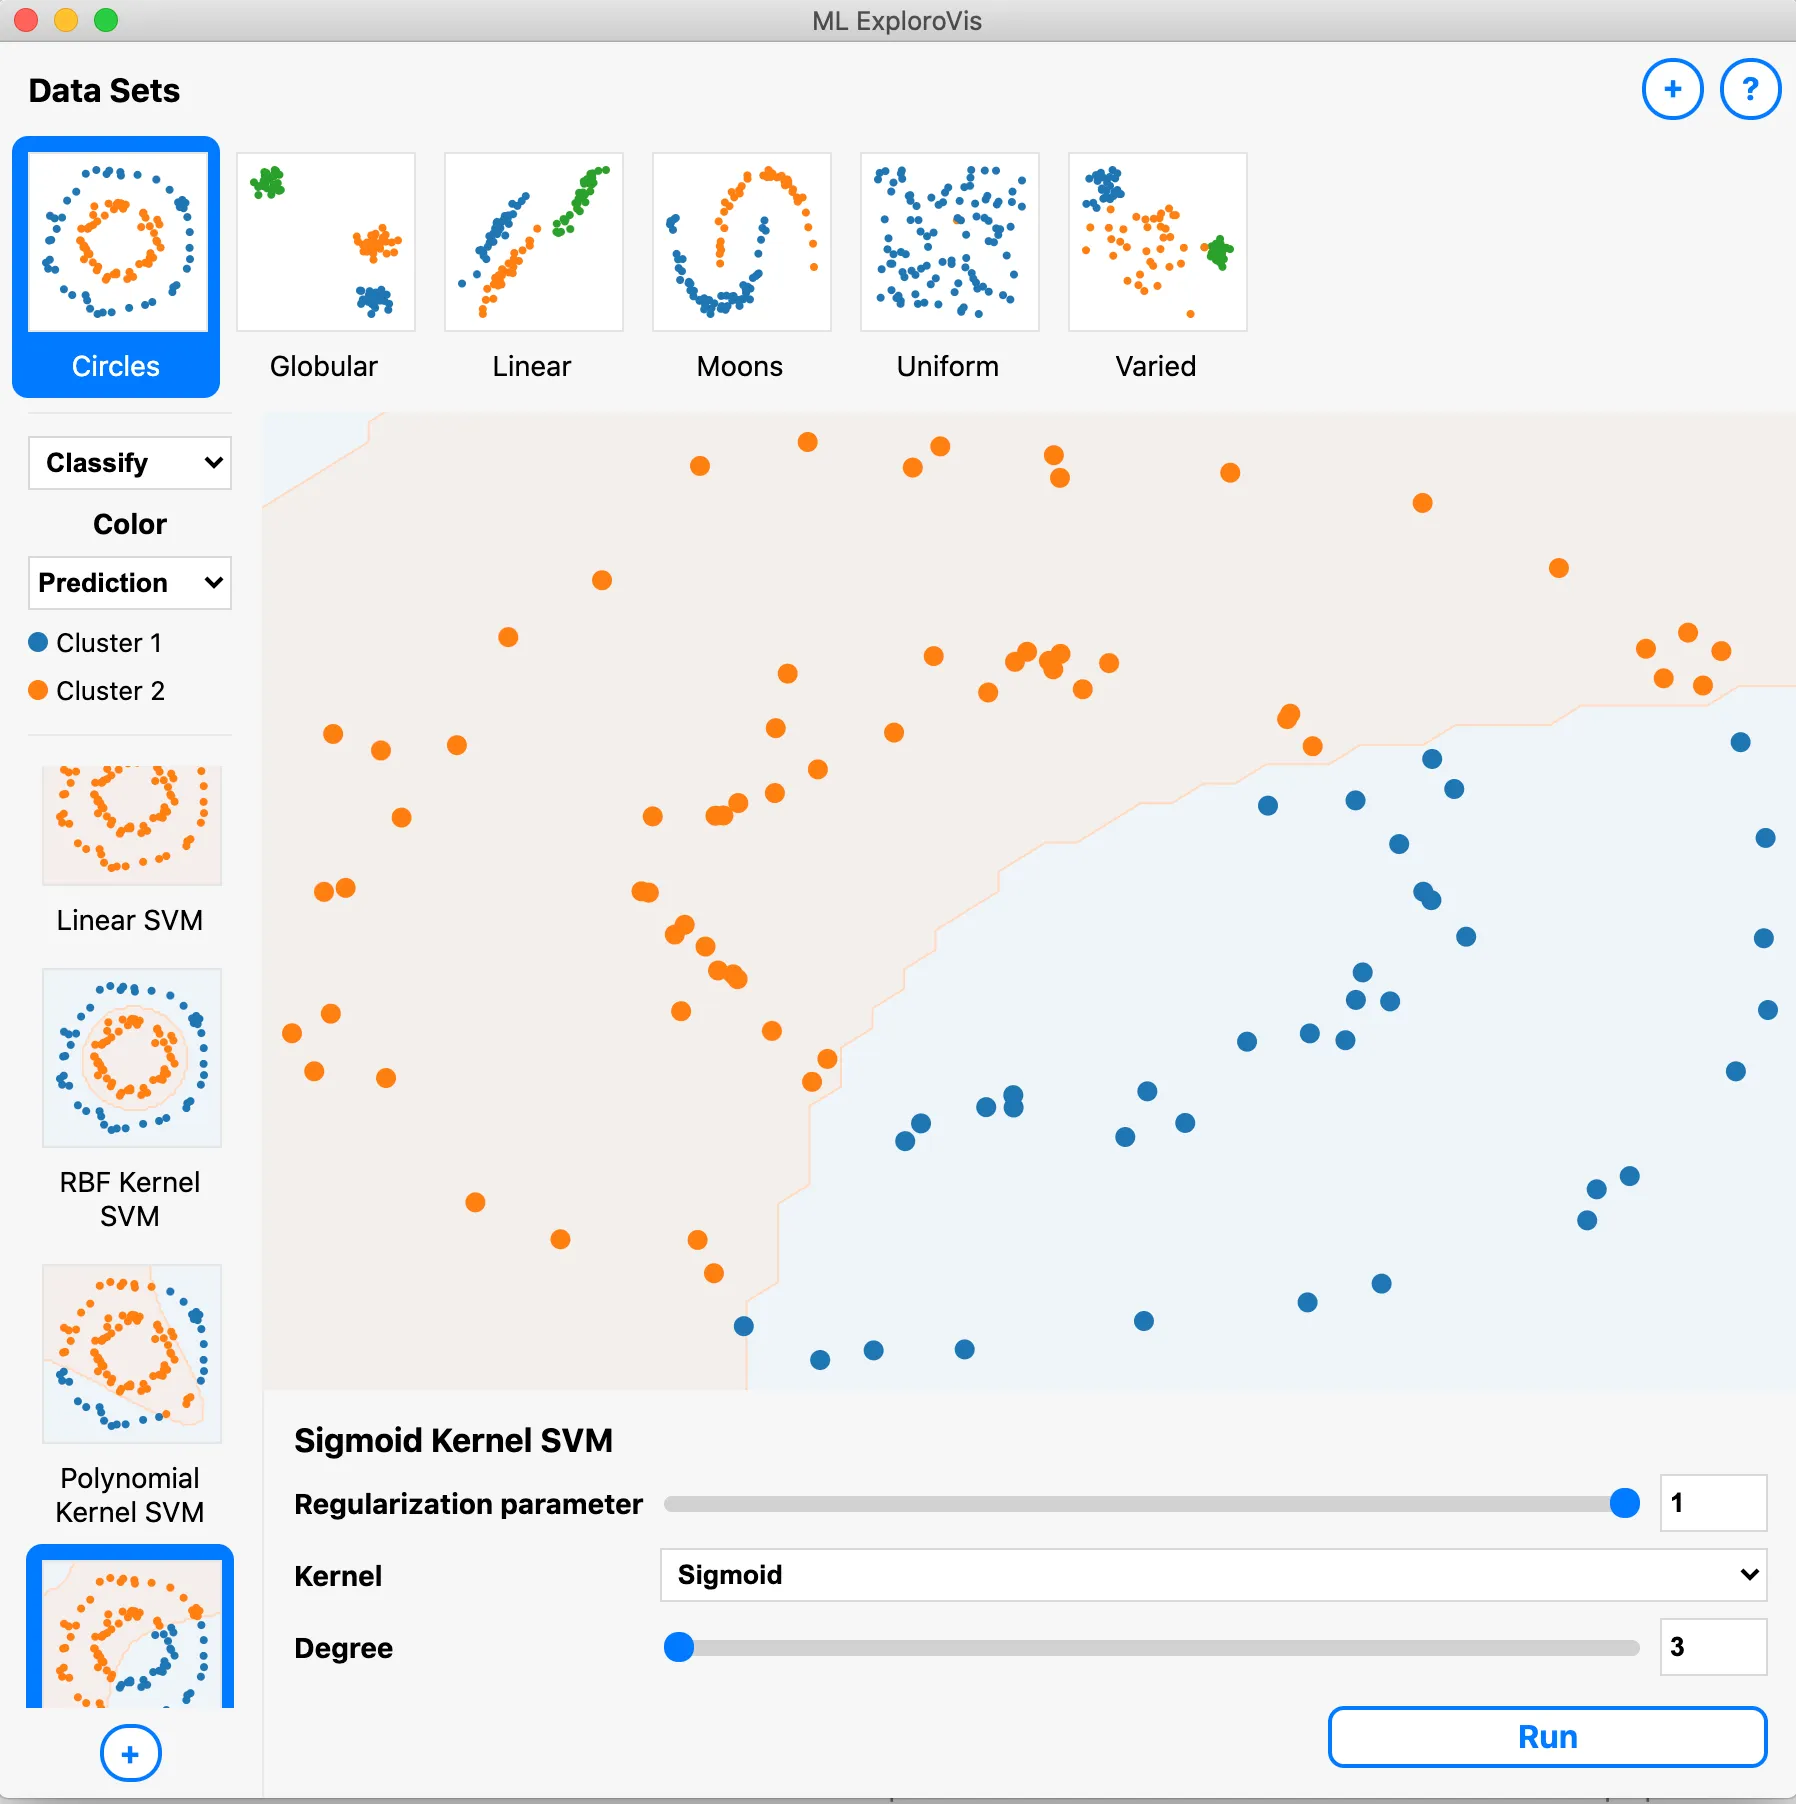
Machine learning can be hard to learn when algorithms are reduced to formulas or hidden behind library calls. Classical methods such as support vector machines, decision trees, clustering, and nearest neighbors become much easier to understand when learners can see how their decisions change with data and parameters. ML ExploroVis explores that idea: it uses interactive visualizations to make algorithm selection and hyperparameter tuning approachable for novices.
Why visualization matters in education
The bet here is pedagogical, not algorithmic: learners build a usable mental model faster when they can see a decision boundary move than when they memorize its equation. In machine learning, that means watching how a boundary responds to a new point, how a kernel reshapes a margin, or how a cluster radius groups nearby samples. Static diagrams help, but an interactive view lets a learner form a hypothesis, change one parameter, and see the consequence immediately.
For classical algorithms, this is especially valuable. These methods have clear geometric intuition: margins, neighborhoods, splits, and centroids all map naturally to shapes on a scatter plot. By surfacing those shapes, a visualization can turn a black box model into something a learner can inspect and reason about.
How ML ExploroVis approaches the problem
ML ExploroVis presents a small set of representative datasets and a palette of classical classification and clustering algorithms in one interactive interface. Instead of teaching one algorithm deeply, it takes a breadth first approach: learners compare methods side by side across the same data and observe tradeoffs.
The tool makes exploration visible through:
- interactive scatter plots with semi transparent decision boundaries
- animated overlays for concepts such as SVM margins and DBSCAN search radii
- side by side comparisons of the same algorithm with different hyperparameters
- multiple dataset shapes, including linear and non linear separability, globular and non globular distributions, and uniform or non uniform density
- a consistent visual language across KMeans, DBSCAN, spectral clustering, neural networks, KNN, SVM, naive Bayes, decision trees, and random forests
- dynamic thumbnails for rapid cross examination and comparisons
Seeing these methods together helps learners answer practical questions: which algorithm fits this kind of data, how sensitive is it to its settings, and what happens when the data becomes harder?
From code to concept
Classical algorithms are often introduced through implementation first: instantiate a model, fit it, and report a score. That sequence can hide the reasoning that motivates the method. A visual first workflow reverses the order, letting learners observe behavior before formalizing it. Once they have built intuition, the corresponding code becomes a natural next step rather than a mystery.
This is the central educational value of the ExploroVis approach: visualization as a mechanism by which learners connect data and algorithm behavior.
The Tech stack
- Python Backend:
- flask
- sklearn
- pandas
- numpy
- networkx
- JS Frontend:
- D3
- electron
- React.js
- Building / Binding:
- pyinstaller